1、极坐标的绘制是使用函数polar(theta,r),theta是角度,r是半径
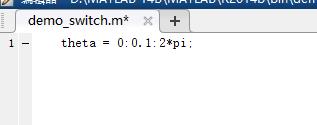
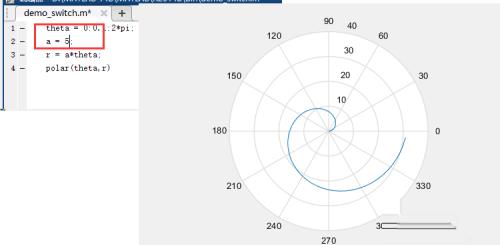
2、首先定义theta的范围theta=0:0.1:2*pi;
3、再定义半径r的范围,a=1,r = a*theta
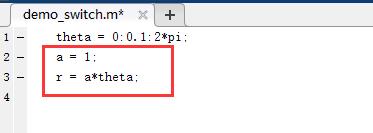
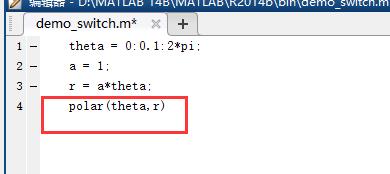
4、使用polar(theta,r)传入数据进行画图
5、运行写入的文档进行绘制
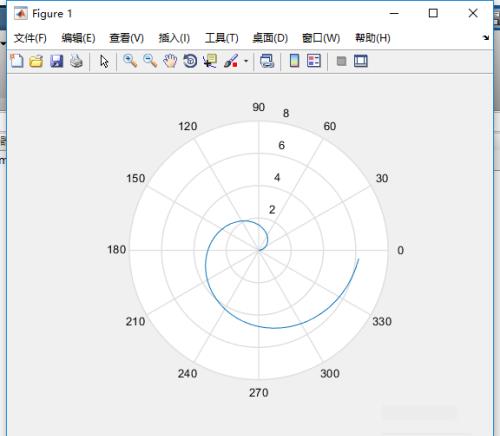
6、当然,你也可以修改参数a的大小来绘制,将a = 5时的极坐标图
7、喜欢就点个赞
1、极坐标的绘制是使用函数polar(theta,r),theta是角度,r是半径
2、首先定义theta的范围theta=0:0.1:2*pi;
3、再定义半径r的范围,a=1,r = a*theta
4、使用polar(theta,r)传入数据进行画图
5、运行写入的文档进行绘制
6、当然,你也可以修改参数a的大小来绘制,将a = 5时的极坐标图
7、喜欢就点个赞
精彩内容尽在问答鸭,如果您觉得这篇内容不错,别忘了分享给好友哦!

1、二次积分在两种坐标系下转化的题型及其解法概述。2、将极坐标系中的二次积分转化为直角坐标形式。3、例1的详细分析与解答。